Writing Task 1 Academic Test Information
- It is advised to spend at most 20 minutes on Task 1 by IELTS, but you have 60 minutes to complete both Task 1 and Task 2, so how you manage your time is up to you.
- Give at least 1 minute to plan your task before writing; take a quick look at your question, write down the key pointers and comparisons, and prepare the writing structure to ensure a coherent and structured response.
- The writing task 1 is assessed on four parameters with an equal weightage of 25%: information thing
- Task achievement: how well the candidate has addressed the task and how accurate the information presented is.
- Coherence and cohesion: It tests the flow of answers and how the ideas are linked.
- Lexical Resource: The range and accuracy of the used vocabulary.
- Grammatical Range and Accuracy: It measures the use of correct and various grammatical structures and tenses.
- The word limit is 150, but I will suggest writing over 150, ideally between 160-180 words. Failing to do so could result in Band 5 in the Task response evaluation criteria.
- It is essential to use correct tenses as it has 25% weightage in your band score. Follow the below guidelines to use tenses:
| No time frame/Date was given, and the present tense is used in the question. | present tense |
| No time frame/Date was given, and the past tense is used in the question. | past tense |
| No time frame/Date was given, and the question uses the future tense. | future tense |
| Past time frame | Past tense |
| Future time frame | Future tense |
| Present time frame | Present tense |
| Past and Present time frame | Past and Present tense |
| Past and Future time frame | Past and Future tense |
| Present and Future time frame | Present and Future tense |
- Generally, students try to use a more passive voice when writing because they think it will boost their band score. However, IELTS writing task 1 does not provide enough opportunities for passive voice, so avoid using it and try to write in active voice as much as possible.
Structure of Writing Task 1
Although there are no standards or restrictions on the number of paragraphs to be used in writing task 1, it should have the following components so you can organize these in any number of paragraphs:
- Introduction – The introduction of a chart or charts given to describe.
How do you write an introduction effectively?
- Keep it simple: Refrain from complicating the introduction by adding complex sentences; save your energy for complex sentences in detailed description/comparison paragraphs.
- Understand what an introduction is: Generally, it is advised to paraphrase the given question, but the introduction is more than that; it depicts everything except the data presented in the chart. Don’t worry; we will understand this from the given example.
- Avoid Factual information: Refrain from presenting any data information in the introductory paragraph.
- Decide between summarise and Listing: If you have more than six categories compared in the chart, summarize them and do not list them individually.
- Maintain Order: Always keep the order of given categories the same. Changing the order for given categories, years, and countries could take extra time for the examiner to understand your answer, resulting in lower band scores.
Let’s understand each point through the following example:
Source: IELTS Essay: Expenditure Bar Chart | How to do IELTS
- Keep it simple: In this case, students try to spend too much time making an introduction using complex sentences. Technically, it is an introduction where the given visual and its components require a detailed introduction to the reader.
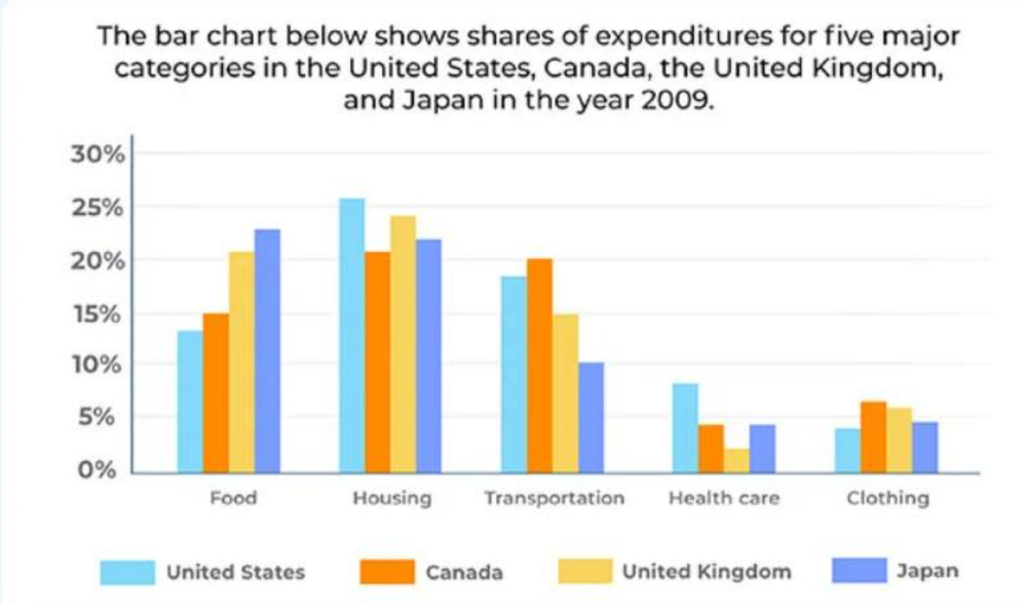
- Understand what an introduction is: Consider the above example; the given bar chart has countries, categories, titles, and units presented, which are percentages in this case. Visualize your given visuals without the data; see the reference image below:
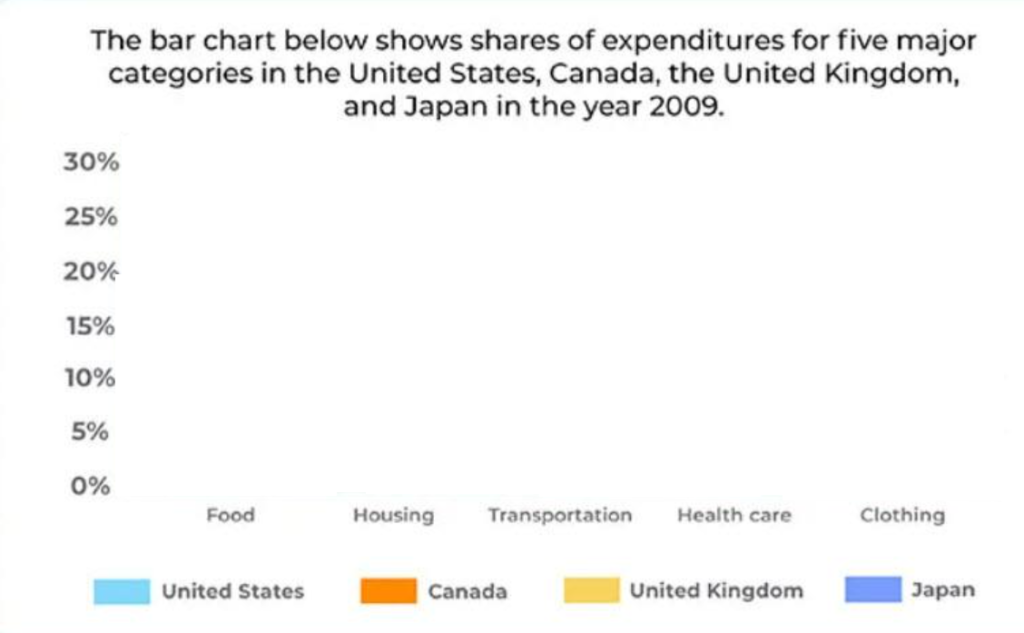
You must introduce this bar chart in detail so the reader understands what it is.
- Avoid Factual information: Do not write any numbers except the period given or categories that have numbers as if there is a visual that presents different age groups; you can write that, but do not write any other numbers present in the data. For instance, we will include 2009 as a number in this example.
- Decide between summarise and Listing: If you have more than six categories compared in the chart, summarize them and do not list them individually.
- Maintain Order: In this case, we will keep the order of categories and countries as mentioned in the question and given chart.
The best introduction is as follows by incorporating all the above pointers:
The bar chart gives information about the percentage share of expenses on food, housing, transportation, healthcare, and clothing in 2009 in the United States, Canada, the United Kingdom, and Japan.
Vocabulary for Introduction
- Illustrates/depicts/gives information about/shows
- Percentage distribution of
- Percentage share of / share of
- Expenses/expenditure/spending
- For showing a period:
- Between … and …
- From …. to ….
- Overview: It is the key highlight of the given visual. Make sure to distinguish between a conclusion and an overview; the biggest difference is that a conclusion summarizes all the topics discussed. On the other hand, an overview is a key highlighter. You should write all the main features that catch your eye when you look at the visual for the first time without specifying the exact numbers or quantifiers.
Let’s take the example of the above bar chart:
The first thing that caught my eye was that the highest expenditure was on housing, followed by food, and the least was on healthcare. And for healthcare and housing, people in the US spend the most money.
Here’s how we can present it:
Overall, the highest expenditure across all countries was on housing, followed by food, while healthcare accounted for the smallest share of expenses. Furthermore, Americans spend the most on healthcare and housing compared to all other countries, whereas Canadians spend the most on transportation.
- Description paragraphs: You can write 2 or 3 detailed descriptions.
Include the exact numbers, compare them with actual numbers/ percentages, and consider trends. Use the corresponding specific vocabulary for each visual, but do not restrict to it only. Practice paraphrasing, complex sentences, and grammatical structures to improve your band scores.